Running SUMOPy#
Start the script sumopy_gui.py by double-clicking on it in your
browser. If this fails, use a command-line application, change directory
to
SUMOHOME/tools/contributed/sumopy
and run sumopy with
python sumopy_gui.py
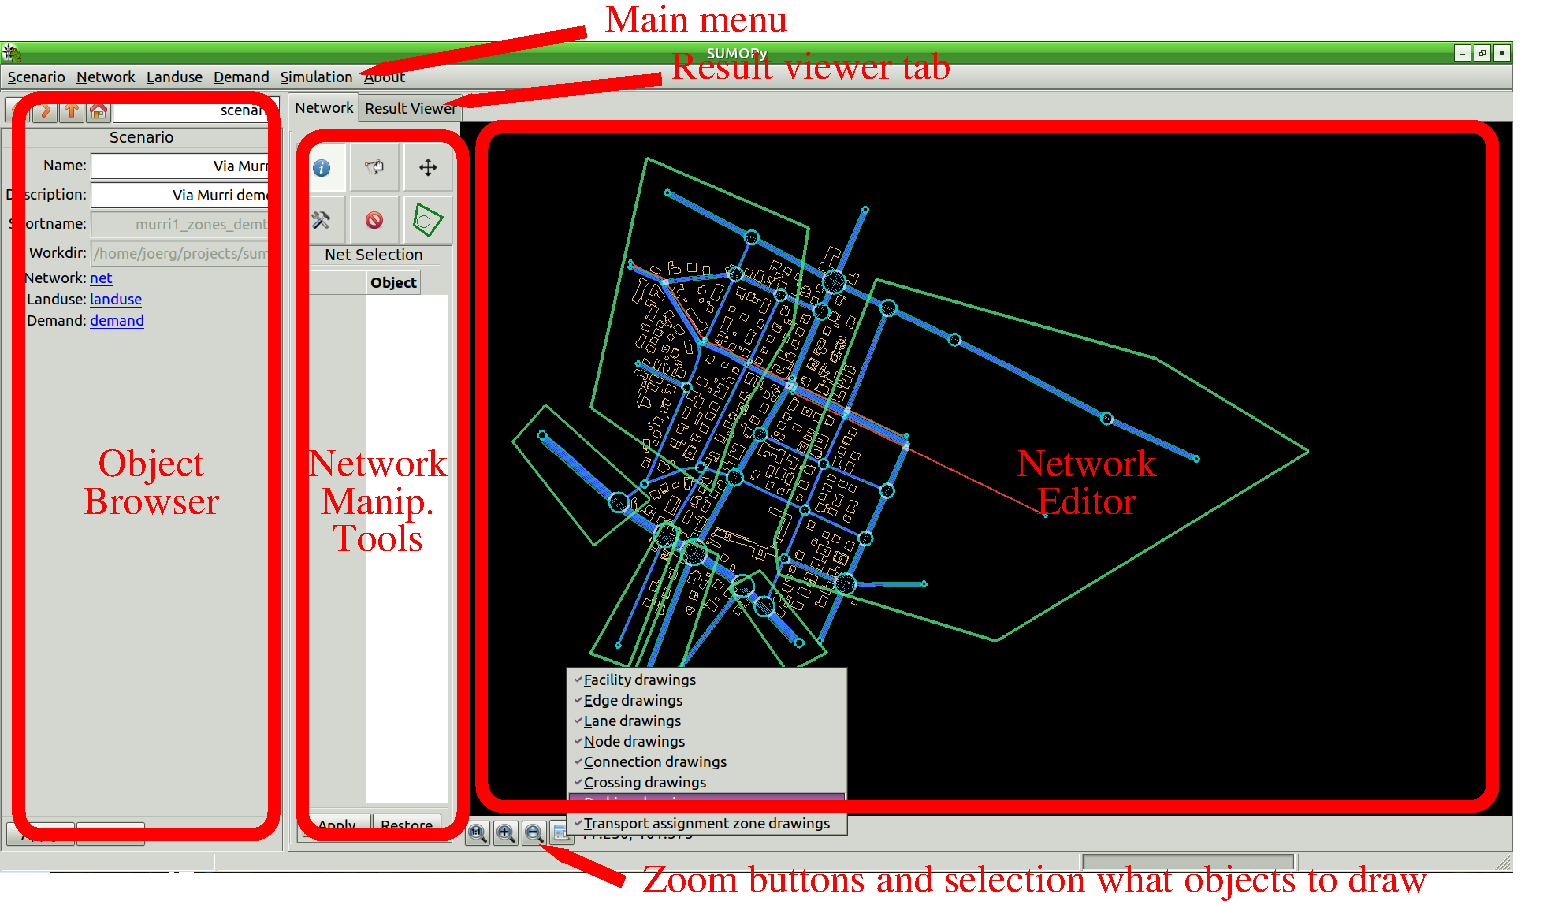
If all required packages are installed correctly, you should see the main window as shown here, but initially with an empty network. The object browser shows initially the main object of SUMOPy: the scenario, which contains all other information.
Opening/creating a scenario#
There is a test scenario in the SUMOPy distribution which is located in
SUMO_HOME/tools/contributed/sumopy/testscenario
The quickest way to obtain results from a simulation is to import
already existing xml-files. In case the following SUMO network, poly
and route files
demo.net.xml demo.poly.xml demo.rou.xml
are located in directory
SUMO_HOME/tools/contributed/sumopy/testscenario
then a new scenario can be created by importing these files into SUMOPy
at ones: from the main menu, choose Scenario>Create from xml... and
insert the scenario Shortname, and Workdir in the form as shown
here.
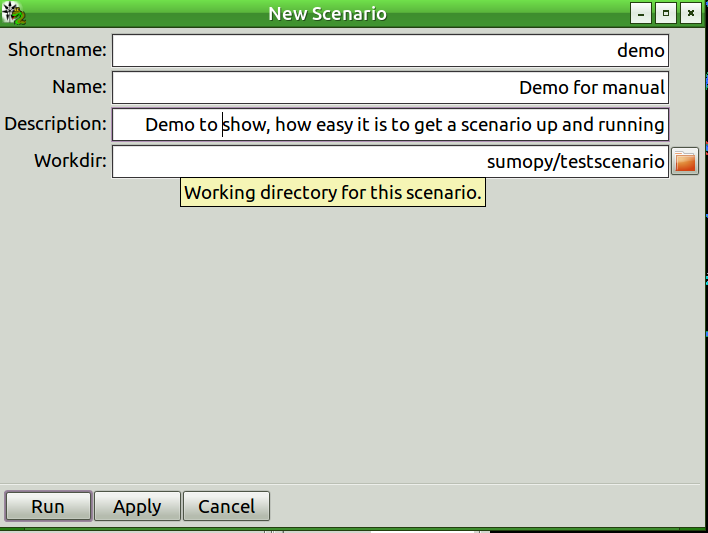
The options Name and Description are free text fields. After
pressing the Run button, network, buildings and routes will be
imported. In case the trip file demo.trip.xml exists, it will also be
imported.
In the same way it is possible to create an empty scenario under menu
Scenario>New....
Browsing the scenario#
The object browser allows to navigate through all information of a scenario. To a certain extend, it is possible to modify data. The most important information are:
- The network with edges, nodes, traffic light systems etc.
- The landuse, containing also the building information from the .poly| file as well as background maps (see later how to import them).
- The demand holds information on available vehicles types, trips and routes.
Navigating the Network#
The network can be examined with the network editor. The initial editing tool allows to click on the different network elements and retrieve the respective information in the object browser.
With the zoom-buttons (+,-) located below the network editor, different zoom levels can be obtained The 1:1 button zooms the network to fit approximately the boundaries of the window. Next to the zoom button is a button which pops up a menu when pressed. From this menu, the network elements to be drawn can be selected or un-selected.
The following mouse-key combination allow to navigate the network:
| Action | Key-Mouse |
|---|---|
| Zoom in/Out | Hold down Ctrl + Wheel |
| Panning | Hold down Ctrl + Shift + Button-Left |
Simulating the scenario#
From the main menu select:
Simulation>Sumo>export routes and simulate...
With this process, the current trips and routes in demand.trips will
be automatically exported to a SUMO .rou file. Choose the desired
simulation settings from the SUMO pop-up dialog, as shown in Fig.
here.
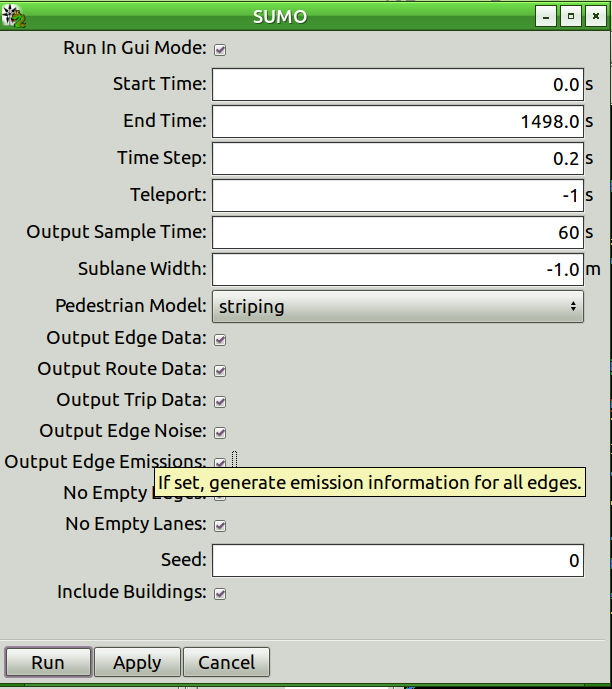
The simulation parameters are self-explaining, just hover with the mouse
over the parameter name. The default parameters are typically suitable
to run a first simulation. Select one of the output options in order to
obtain specific simulation results. Regarding outputs, the Output
Sampling Time for the different outputs may be of interest. If you
observe in the simulations that vehicles get blocked at junctions for no
obvious reason, then it is possible to resolve conflicts by setting the
Teleport to a positive time (i.e. 10s).
After pressing the run button, the sumo-gui interface pops up, ready
for simulation, as shown Fig.
here.
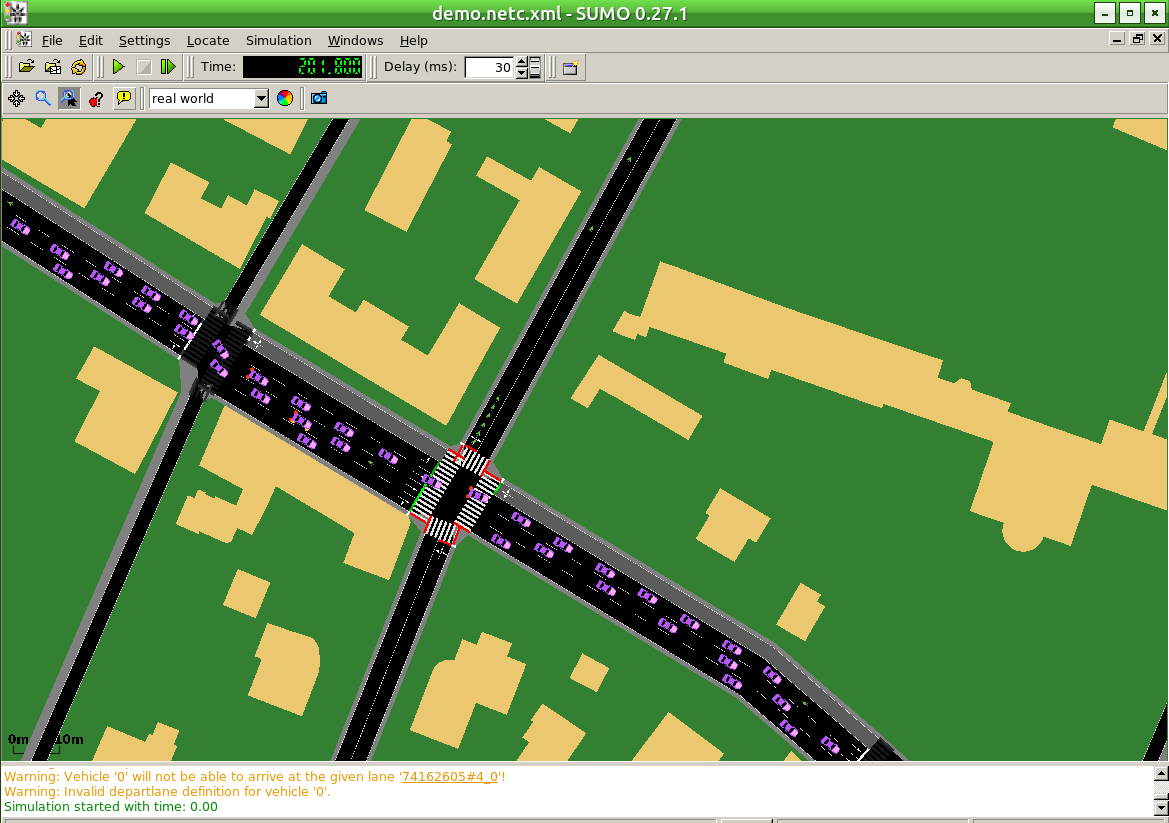
Adjust delay time and press the Start button. At the end of the simulation, confirm OK and close the sumo-gui window. Simulation results are now imported into SUMOPy and are ready to be examined, visualized and exported in various formats.
Viewing results#
The results can be viewed in table format and graphically, see here.
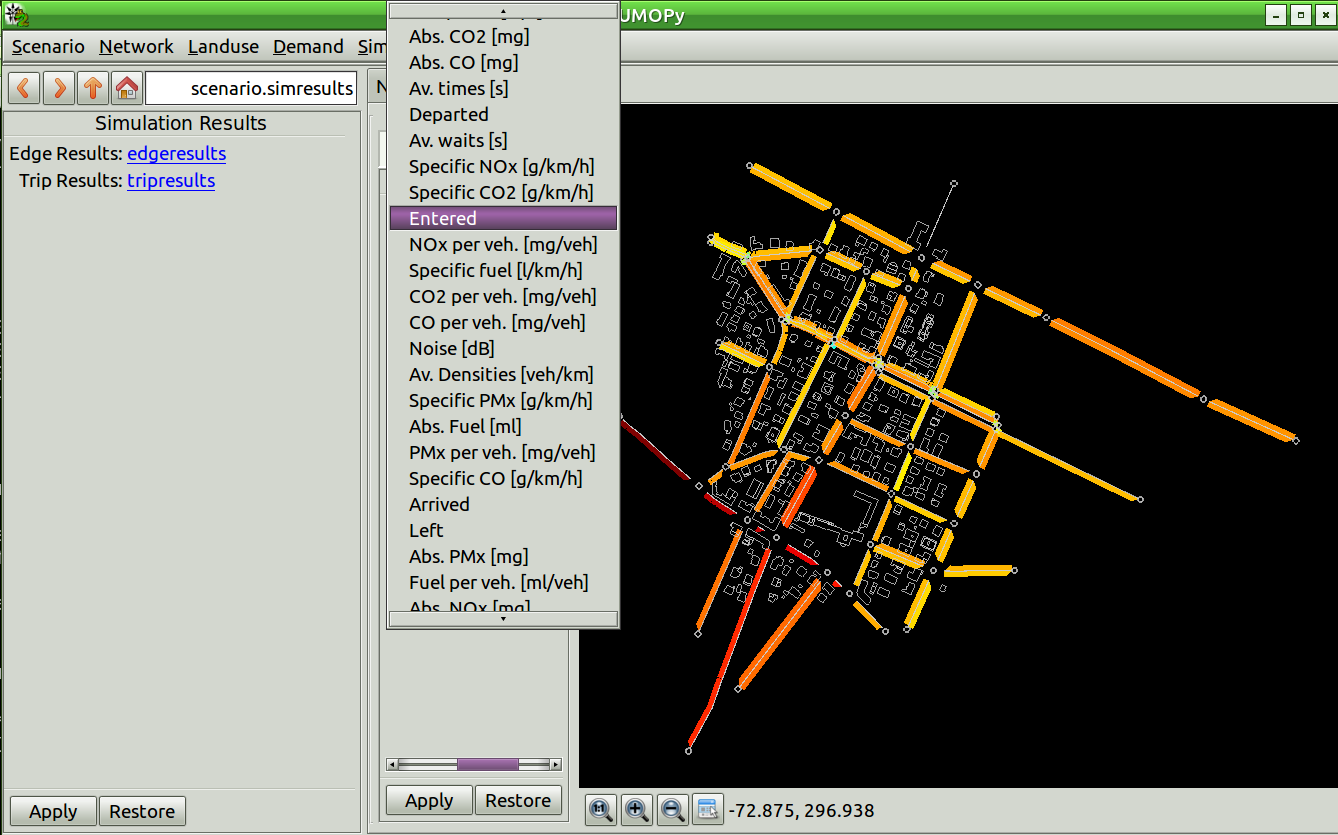
In the object browse, the results per trip and the results per edge can
be viewed. Both, trip and edge oriented result-table can be exported in
CSV format, see the Simulation>Results menu.
Results are not saved when saving the scenario. Instead the results must be saved separately using
Simulation>Results>Save as ...
At any time, results can be reopened with the scenario with which they have been produced, using:
Simulation>Results>Open ...
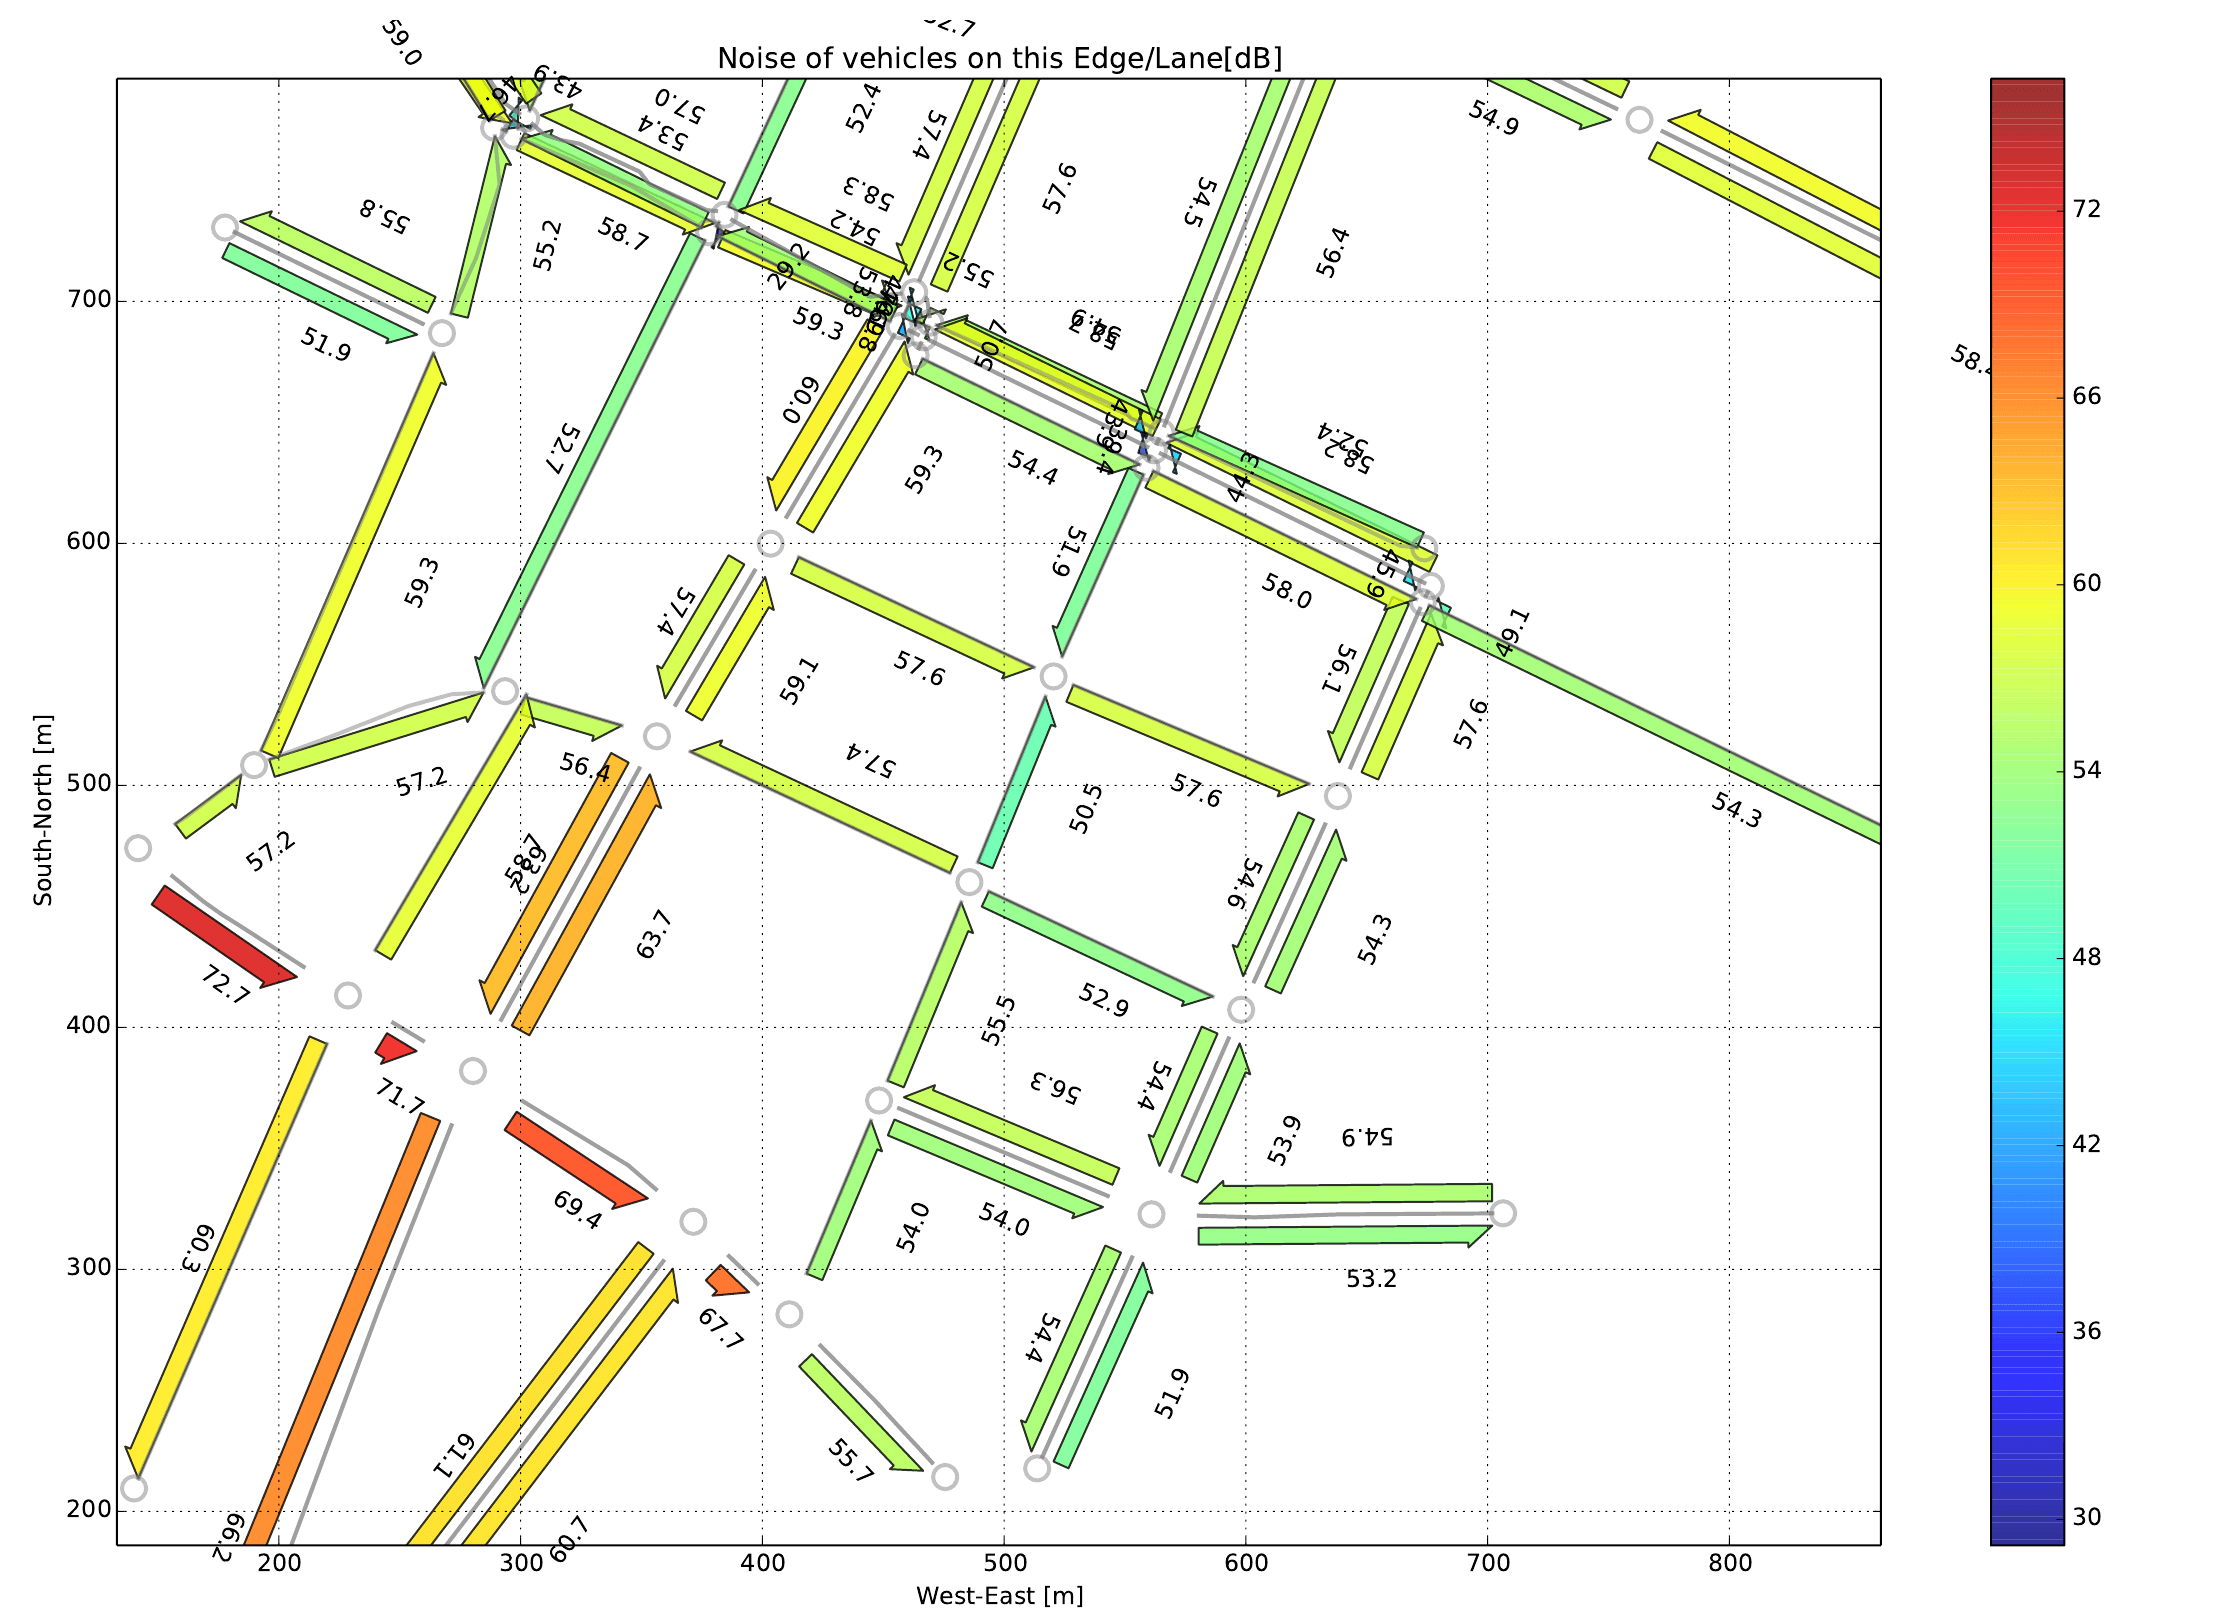
In case the Matplotlib package is installed you can generate plots in
various formats, choosing menu Simulation>Results>Plot with
matplotlib. The pop-up dialog helps to configure the graphical details
of the matplotlib plot. From the matplotlib figure window, the graphical
results can be exported in different file formats (PNG, PDF, JPEG,
etc.), an example PNG file is shown
below.
Launching SUMOPy#
As explained above, networks can be created from SUMO XML files, or a binary file can be loaded. Both operations can be performed from the command line.
Loading a binary scenario at start#
A previously saved, binary scenario with filename scenario.obj| can be loaded into SUMOPy at start using the commandline
python sumopy-gui.py workdir/scenario.obj|
Importing SUMO XML files at start#
An initial import of existing SUMO XML files with rootname scenario| and located in directory workdir can be accomplished with
python sumopy-gui.py scenario workdir
Importing and Editing networks#
if needed, the network should be modified before moving on to demand modeling.
Importing nets and buildings#
Networks can be import from a SUMO net.xml file with
network>import>from sumo net.xml ...
Networks can be converted and imported from a previously downloaded OSM file, calling a wizard with:
network>import>from osm.xml ...
Different types of buildings, parks, car parking, leisure areas, etc (in SUMOPy called called “facilities”) are a property of the landuse object and can be extracted and imported from an OSM file with menu item
landuse>facilities>import from osm...
Sometimes special characters in the XML file are offending the python XML parser, leading to errors during import. If this occurs, simply “clean” the respective OSM file with
landuse>facilities>clean osm file...
prior to importing it.
Editing with SUMO’s netedit#
The recommended way to edit the network is via netedit, which is provided with SUMO from version 0.25. SUMO’s netedit can be called by choosing the menu
Network>Edit with netedit
netedit will be fired up with the network ready to be edited. The use of netedit is documented here: https://sumo.dlr.de/docs/netedit.html. After editing, the network must be saved within netedit| be pressing Ctrl + s or with File>save. Then netedit can be closed and the modified network will be reimported into SUMOPy.
Editing with SUMO’s netedit on background maps#
There is a possibility to edit the network with netedit| on background maps. Currently these are Google Satellite maps. Before editing with background maps, the maps must be downloaded for the given network area. This is accomplished by a wizard which can be called selecting the menu item[1].
landuse>maps>download...
The wizard helps to download the squared tiles which cover the network area. The resolution can be defined by setting the tile width (and height) in meters. The tile size in pixel is maximum 1280 (using the Google Map server). The resolution is then tile size/tile width in pixel per meter.
it is highly recommended to press the Apply| Button prior to downloading the maps. This will calculate the number of tiles which are going to be downloaded. This is important to know, because Google maps prevent IPs from downloading too many maps of an area. Therefore do not exceed about 300 tiles! Note further that, dependent on the performance of your computer, netedit may run into problems to handle too large map areas.
After the maps are downloaded, netedit can be called with
Network>Edit with netedit on map
in order to edit the SUMO network on a map.
Editing with SUMOPy Networkeditor#
The SUMOPy internal net-editor provides currently some limited capability to edit the network
- The geometry of edges and buildings can be manipulated: Activate the Move| tool to move or the Stretch| to change vertices.
- With the menu
Network>Clean nodesall edges entering a node are “cut back” to a certain radius. This measure may facilitate the verification of connections between lanes at junctions.
- In SUMOPy Maps are managed by the landuse object
